Interviews
Kameelah Janan Rasheed What a Diagram Cannot Hold: on Data, Opacity and the Choreography of Knowledge

What does a diagram reveal, and what must it leave out? For artist Kameelah Janan Rasheed, visualisation is never simply a matter of making information easier to see. It is also a question of what gets counted, whose knowledge becomes legible, how bodies move through information and when the demand to be visible becomes a form of control. Beginning with W. E. B. Du Bois’s striking data visualisations, this conversation moves through the political uses of aesthetic seduction, the textures of black-and-white printmaking, the choreography of exhibitions and the extraction of data beyond death. Rasheed challenges the idea that information arrives as a finished, neutral object: data is made, situated, revised and sometimes resisted. What might follow if we treated visualisations not as authoritative conclusions, but as objects that people could question, rearrange and collectively interpret? The conversation closes with a speculative proposition for democratic spaces built around porosity, comfort, uncertainty and time.
Du Bois and the limits of what can be counted
Olivier: I first encountered your work through your engagement with W. E. B. Du Bois’s data visualisations. Would you call what you do an interpretation, a re-enactment or something new? What are you trying to carry from his historical work into the present, and what needs to change?
Kameelah: I think for a lot of young Black people, an early introduction to Du Bois is The Souls of Black Folk and his questions about double consciousness and what it meant to be a Black person at that particular time. That book was foundational for me, but it wasn’t until I saw his data visualisations that something clicked.
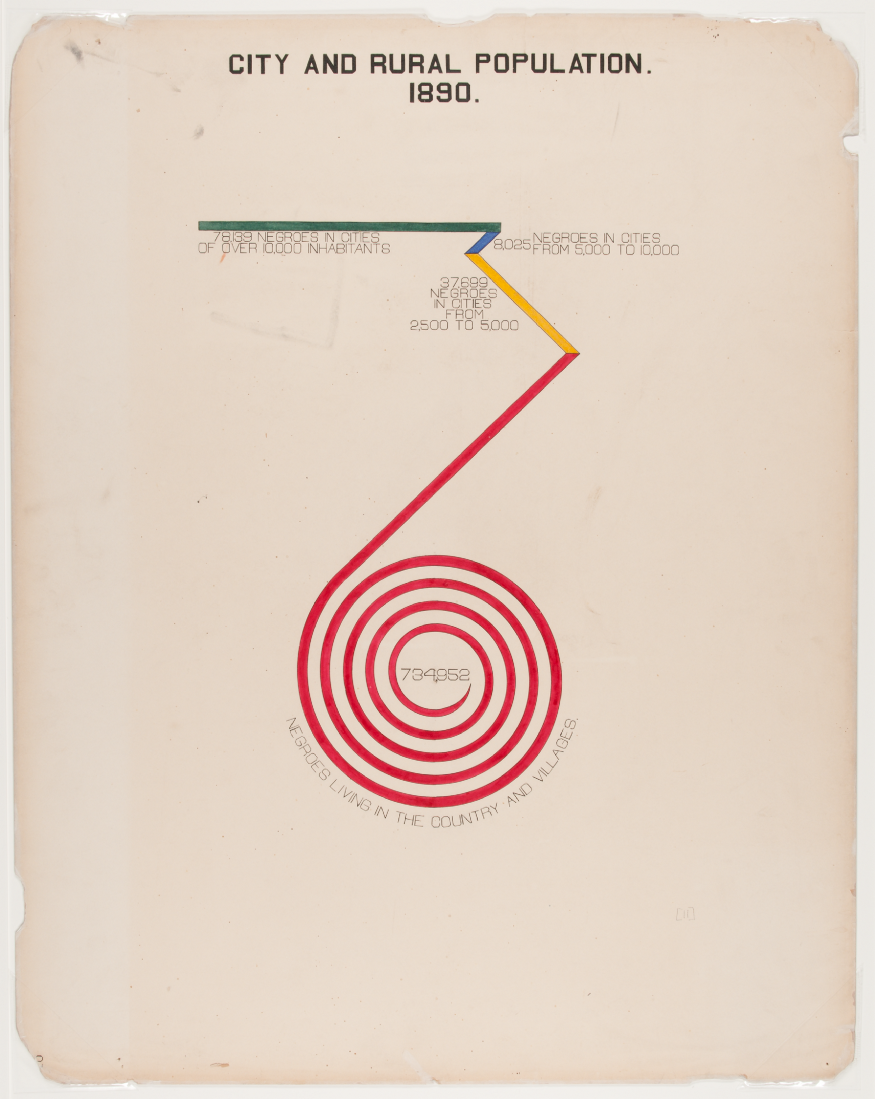
What clicked was the question of audience and our relationship to information. What does it mean for someone to read a book that expands their ideas, and what does it mean for a particular audience at a world exposition to encounter these charts and diagrams? Du Bois compresses very complex information into beautiful diagrams that do several things at once. They illustrate, they make an argument, and they announce: this is worth counting; this is worth enumerating.
There is also a difference between making an argument in a book and making one in the compressed language of a diagram. At an exposition, people may move past an image quickly, and it has to perform a certain amount of work before anyone decides to stay with it. I am fascinated by that economy of attention. The charts aren’t just offering information for the sake of it. They are insisting that particular Black lives, circumstances and histories merit the work of enumeration in the first place.
But I am equally interested in what a diagram can and cannot hold. What exceeds the diagram? What exceeds legibility? What can and cannot be counted?
I return to Katherine McKittrick’s writing on Black mathematics and questions of enumeration, including how we account for loss. I also think about Saidiya Hartman’s Venus in Two Acts. These works don’t necessarily counter Du Bois; they sit alongside him. There is what can be counted and illustrated, and then there is what cannot. So much of our attention goes towards what is tangible and material because counting provides a sense of ease and comfort. But how would you mathematically represent trauma? How would you visualise something that is not ephemeral, exactly, but feels intangible?
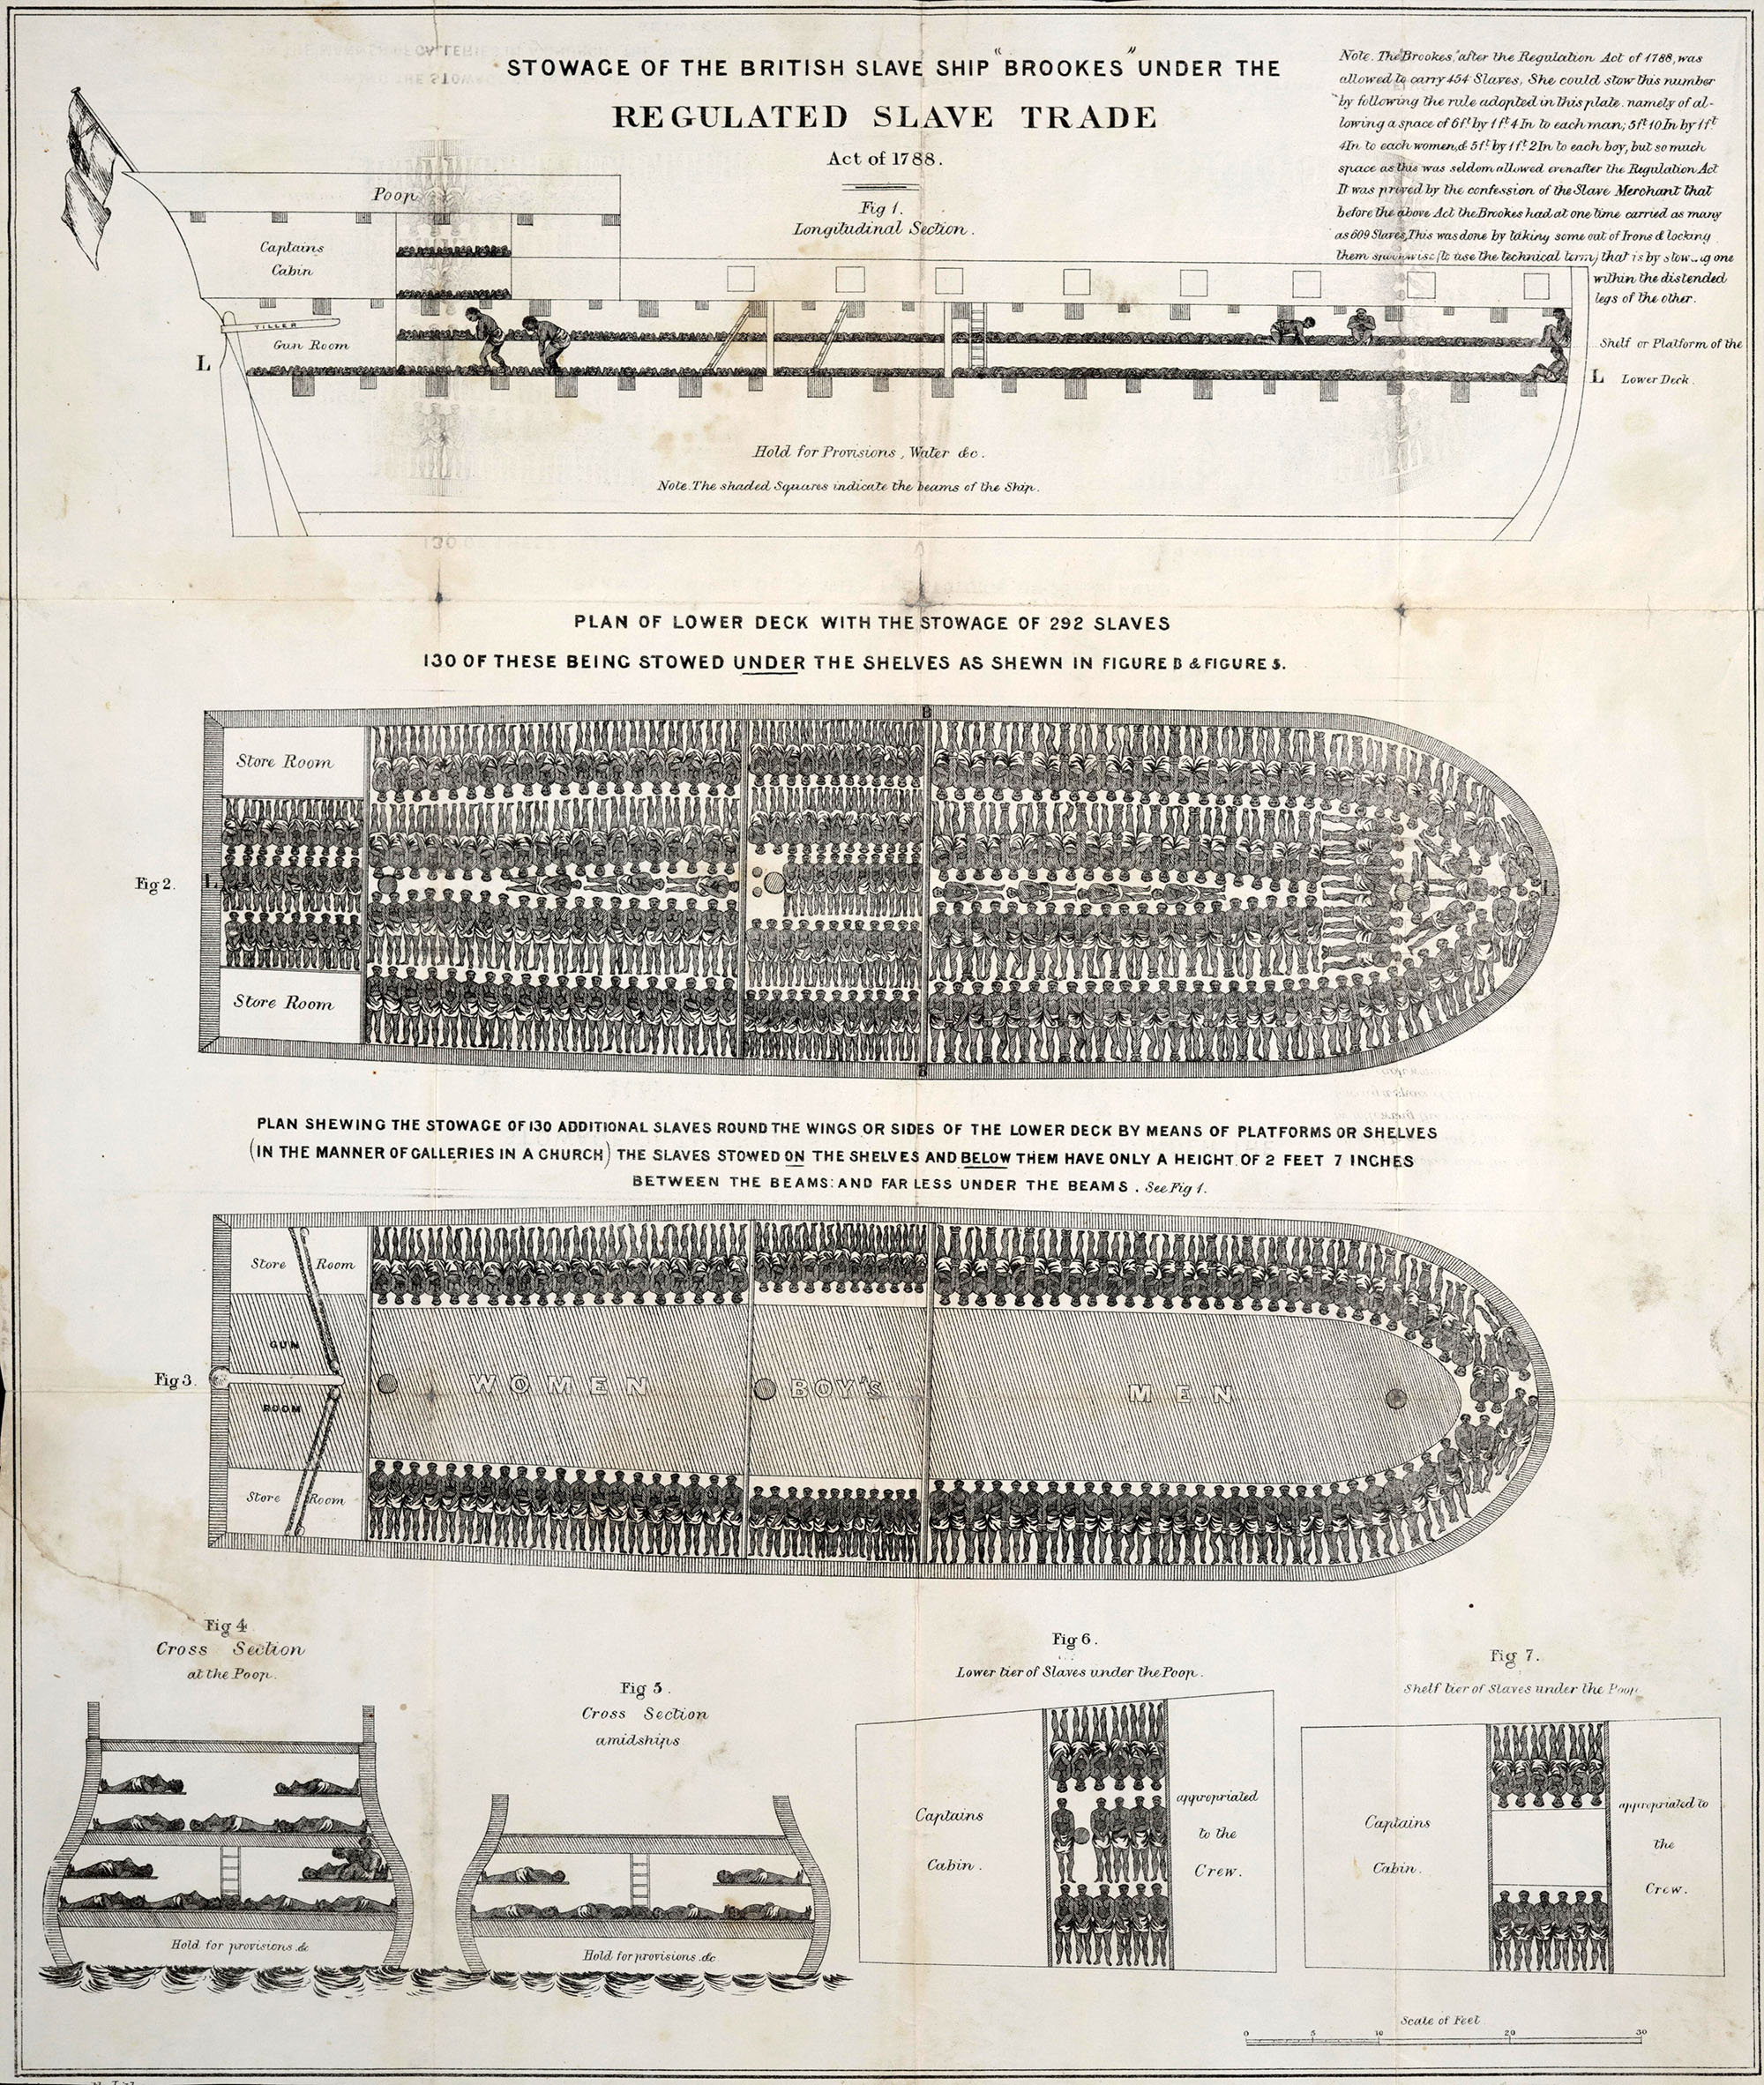
Plan of the British slave ship “Brookes”
James Phillips for the Society for Effecting the Abolition of the Slave Trade (1791)
Hartman is important to me here because the question isn’t simply how to recover information that the archive didn’t save. It is also what we are doing when we demand that the archive produce a knowable account. There may be an impulse to complete the record, to fill the gap, to calculate the thing that wasn’t calculated. But some experiences don’t become more comprehensible just because we place them inside a visual or mathematical form. These different thinkers help me resist an easy division between what we can know through a chart and what supposedly sits outside knowledge altogether.
Christina Sharpe writes in In the Wake about the atmosphere of anti-Blackness. Part of what cannot be calculated or put into a chart is that atmosphere, that environmental weight. How do you count that? That’s one of my entry points into Du Bois.
Adversarial poetics: what diagrams conceal
Olivier: Du Bois’s diagrams are visually extraordinary, and their beauty is often the first thing people notice. When does reactivating a historical visualisation become more than an aesthetic quotation? What makes it politically meaningful?
Kameelah: I was recently in Morocco on a research residency where I spent a lot of time thinking about adversarial poetics. Manuel Arturo Abreu has written about a much longer lineage of adversarial poetics: people trying to encrypt, hide and embed information long before computers and computation. Methods of secreting and encoding information exceed Silicon Valley.
I’m drawn to the fact that encryption isn’t only a technical process invented alongside contemporary computing. It can be an artistic, literary or political strategy. Something can be present but not immediately available, and that difficulty can itself matter. We are accustomed to thinking that good communication makes everything accessible at once, but cultural practices of resistance have also depended on making certain things harder to access or making them legible to a particular community without revealing everything to everyone.
When we look at a chart, the immediate impulse is to ask what information is there, because we assume that what is there is what we are supposed to get. But I also think about Pope.L and his language around hole theory. What isn’t there? What are the holes in the documentation, the holes in the empirical evidence?
In 2019, I made a body of work called A Casual Mathematics. It came out of thinking about the failure of very claustrophobic formulas for liberation: do X, Y and Z, and liberation will follow. I was also thinking about Nina Simone’s “Mississippi Goddam,” about following the formula, doing all the things you are told to do, and still ending up in the same place.
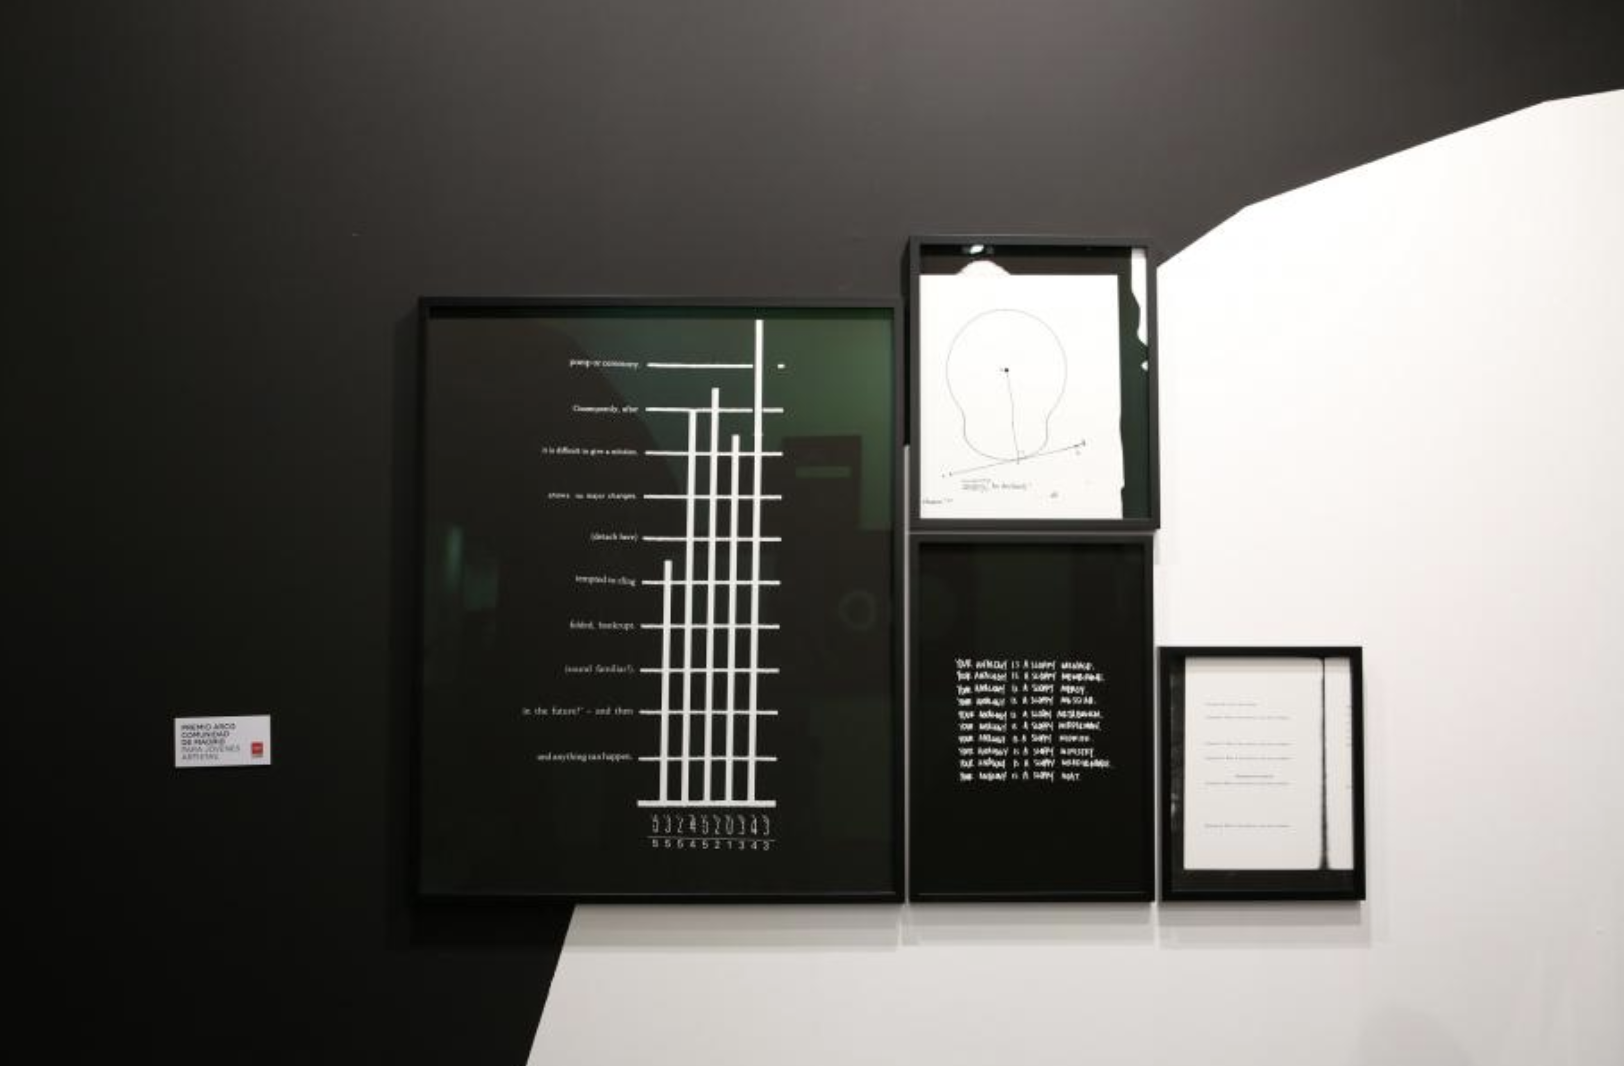
A Casual Mathematics, 2019
Kameelah Janan Rasheed, Colección CA2M
Re-engaging with Du Bois carries a great deal of responsibility. It is easy to take a historical figure, make them mirror what interests you in the present, and produce a work around that. I don’t want to use Du Bois as a sieve through which I pass my own interests. Instead, his work gives me an opportunity to ask: What are we trying to document now? What are we trying to enumerate? What are we trying to position?
There is also a temptation, especially at the present political moment, to read history as though it were waiting to validate the arguments we want to make today. I don’t think that is a particularly interesting relationship to the past. The difficult part is to take the work seriously in its own circumstances, while allowing it to unsettle our contemporary habits. The point is not to make Du Bois into a contemporary artist or designer. It is to ask how his work can change the questions we are prepared to put to our own practices.
Of course, the diagrams are visually stunning. Seduction is part of graphic design and visualisation: you need something that draws a person closer. But I wonder if, as with adversarial poetics, the beauty draws us towards an image only for us to encounter something else there. The visual attraction may not be the thing we are supposed to take away. Attempts to embed, encode or point elsewhere have long been part of cultural resistance. I hesitate to imagine that Du Bois was concerned only with the information immediately visible in the diagram, rather than with what it could point towards beyond itself.
Diagrams in space: the body as a reader
Olivier: That raises a question about display itself. Your work suggests that meaning is produced not only by what is shown but also by where and how someone encounters it. How do you think about the relationship between an exhibition, the space around it and the visitor moving through it?
Kameelah: I’ve only recently come to understand my work as deeply diagrammatic. Someone had to point that out to me. A diagram usually works through compression or centralisation, and one question I ask in my installations is whether we can make a diagram that doesn’t depend entirely on those logics.
I might produce something with the logic of a diagram, but its elements spin out of orbit or are thrown across a space. There isn’t always an easy line connecting one thing directly to another. Sometimes there is an implied line; sometimes a line is explicit; sometimes you have to imagine it. I like playing with those relationships because they point people elsewhere.
That means that a diagram doesn’t always have to give you a complete overview. A viewer might recognise a relationship without being able to trace a single, continuous line between two elements. Or they might have to hold something in memory while crossing a room to encounter the next piece. It is partly about how we imagine connections when the object refuses to draw them for us. I’m interested in that movement between what is stated, what is suggested and what you have to produce through your own encounter with the work.
I think of a diagram as something embodied, something that takes up the entire space and is created with our bodies. I remember encountering a Fluxus score associated with Ken Friedman about how the act of looking or relating to something creates a sculpture. I’m paraphrasing, but that idea stays with me: a sculpture isn’t a sculpture simply because an object occupies a room. There is also a sculpture in the relational process of looking, orienting and pointing.
If I’m walking through a museum and looking towards an object, the direction of my attention is itself doing something in space. There is something beautiful about that embodied dimension.
I am interested in taking something folded inside a textbook or a book and opening it up to scale. Think about a diagram on a phone, perhaps a small square graphic made for social media. You’re mostly moving your eyes back and forth. Now imagine that same information enlarged so that you stand in front of it and move your body from one node to another. That changes your relationship to the knowledge.
I want to make those assumptions visible by asking what happens when the same relationships become a room, a route or a physical encounter rather than a small image on a screen.
I think this is especially interesting when we look at the tools people use to generate images and share knowledge. Canva, for instance, makes it easy to produce a square diagram for circulation on social media. But software also carries an implicit logic about what information should look like, how large it should be and how it should be divided. The format can disappear from our attention precisely because it has become so familiar. I want to make those assumptions visible by asking what happens when the same relationships become a room, a route or a physical encounter rather than a small image on a screen.
So when I organise an installation, I’m thinking about embodiment, choreography and recursion. People might begin at one point and move to another, and that movement is not just for fun. Kinesthetically, walking and moving can be ways of encoding knowledge. I want people to think not only about what I’ve put on the wall, but also about the knowledge created by moving between things.
Black and white: texture, constraint and visual seduction
Olivier: Black and white are so distinctive in your visual practice. What happens when you remove colour? Can that constraint make us see the language of visualisation differently?
Kameelah: There are two reasons I began working predominantly in black and white. The first is that I had been using more colour and started to feel I was cheating a little. Colour was doing the work of emphasis and carrying the message. There’s nothing wrong with that, but I love constraints, so I challenged myself: could I do this using only black and white?
Around 2015 or 2016, I was also doing a printmaking residency. When it ended, I still wanted to make monoprints, but I wasn’t going to buy a Vandercook press. So I bought a Xerox machine. I went back to methods I’d used as a child, going to copy shops with my mother. I fell in love with the copy machine as a DIY tool, one that radical movements have used to circulate information more democratically.
But Xerox machines are also beautiful, painterly machines. You don’t get only black and white. You get gradations, tonality, texture, noise, all this information. I realised that I wasn’t working with just one colour: I was working with different textures, depths, tonalities and directions of black. That’s where nuance and emphasis could happen. It was another kind of brushstroke.
The Xerox was also a way to continue a practice without relying on the equipment of a formal print studio. I could make things, reproduce them, change the source material and see what the machine gave back. I was interested in the history of photocopying as a means of getting material into circulation, but also in all the effects that are normally regarded as imperfections. The machine translates the surface in ways that aren’t entirely predictable, and that translation can become part of the work rather than something to correct.
If we desaturated Du Bois’s diagrams, I think they would lose something. He used colour and line intentionally to communicate information. But I could imagine another visual language in which texture does that work: a pie chart differentiated by surface, luminosity or reflectivity instead of colour.
In my own practice, I’m interested in how far I can stretch a single colour or tone, rather than how many colours I can use. I’m also increasingly cautious about presentation, seduction and appearance. When I think about media literacy, I notice how advertisers use colour online, how shops use it to direct our attention, how we’re pulled through commercial spaces. At the airport, you have to walk through clouds of perfume and products before reaching your gate. There is something about saturation and overexposure that concerns me when they’re used against us.
I think the issue is also what we expect from a visual language once it becomes persuasive. A bright, highly saturated image can appear to tell us which part of the message is important before we have decided that for ourselves. A monochrome image can also guide attention, of course, so it isn’t a simple moral opposition between colour and black and white. For me, the constraint creates a question: what happens when I can’t reach immediately for a different colour to establish a hierarchy? Could a change of density, an interruption in a line or a patch of noise do that work instead?
That doesn’t mean I’m against colour. I’m interested in saturation as a poetics and a politics in other contexts. But I want to study colour more precisely, so that when I use it I understand not only that I like it, but how it works psychologically, materially and spiritually.
Architecture as a collaborator
Olivier: Could you take us through a particular installation in which the space itself played a major role? What was the spatial arrangement actually doing?
Kameelah: One example is my contribution to Greater New York at MoMA PS1. When I received the invitation, I was excited. I’d been living in New York for about 15 years, and I consider myself a New Yorker, although people may argue about that.
When we were discussing the space, I said I wanted corners. I love corners; they’re beautiful vortexes. Then I walked into the museum and they showed me a long hallway. They asked whether it was okay, and I thought it was perfect.
I like to collaborate with architecture. I think of it as a co-conspirator: we’re trying to do something together. A hallway implies a destination. You’re drawn towards something at the end, but other things happen on both sides of you within a narrow environment. So I asked myself: how do I create something large and diagrammatic when the walls are separated? What’s the connective tissue? Where is the line?
There was a large video, about ten feet tall, on the wall at the end of the hallway. As you moved towards it, there were videos along the side walls, then others on CRT screens. Something followed you sonically and visually. There was also a more traditional diagram, from which smaller paintings seemed to spin out, pointing towards the videos and other works.
What I appreciated about that hallway was that I didn’t have to invent the fact of movement. The architecture was already directing people; my task was to respond to that direction and perhaps complicate it. A person is pulled towards the large image at the end while smaller works and sounds ask for attention at the sides. There is no single moment in which the whole thing is available from one position. The installation unfolds differently depending on where someone pauses, how quickly they move and what they notice first.
My interest in space is connected to my time as a high-school teacher. I taught for about five years and then worked for another ten in curriculum development. I remember students telling me, very seriously, that they needed to stand up and move around in order to think. At first I thought they were playing with me, but they meant it. That stayed with me and deepened my interest in kinesthetic learning and the relationship between movement and knowledge production.
I’m trying to understand knowledge production not as a solitary, stationary activity, but as a mobile, itinerant process that includes the body. When I’m given a space, I study it. I watch how people move in and out, where bodies congregate and where they don’t. I do my own amateur life studies. Could I position a work so that someone moves into a corner they wouldn’t normally visit?
I pay attention to the gestures people make without necessarily realising it. They might hesitate at an entrance, move close to a wall or avoid a corner because of how the architecture presents itself. I am not trying to prescribe one correct itinerary, but I am interested in how installation choices can open another possibility. Sometimes the decision to place a work in an unexpected location is enough to change the way someone inhabits the entire room.
I think with the space, and I change my ideas in response to it. I don’t like the idea that you can simply pick up my work and put it somewhere else. When work moves, I go with it to figure out where things need to be. The individual pieces may be the same, but they have never been installed in exactly the same way, because no two spaces are exactly the same.
When data becomes choreography
Olivier: We’ve been exploring the idea of moving through data, including through practices such as Legislative Theatre, where people embody experiences, rehearse alternatives and sometimes translate these into policy proposals. Could data itself become a score or a choreography that people inhabit and transform together?
Kameelah: For several years I’ve worked with an MFA dance programme, teaching writing and language with a friend to dancers in Montpellier in the south of France. That work has shaped how I think about movement and data. Dancers ask questions such as: what does it mean to document my practice? How do I create notation for something that moves? I also met someone who had sold a dance to a major museum, and just thinking about what it means to sell a performance raises all sorts of questions.
With dancers, these questions of documentation are not abstract. A movement happens, and then you have to decide what would count as its record. Is it a notation, a description, a video or something another person can perform? And what happens when an institution acquires a performance? The questions we ask about datasets—what is captured, who determines the format and what remains after the event—also appear when a person tries to transmit a choreographic practice.
There are two directions here. One is how we might choreograph data: take information, make a score, transform it and discover something we didn’t know was there. The other is how data choreographs us. We enter a field of information already shaped by data, already carrying habits and assumptions. We’re not approaching it from a neutral position.
I am interested in what can be enumerated and counted, but also in what escapes datafication: things that can’t be parsed, reduced or cleaned up. No amount of data janitorial work will fix them. They’ll always be dirty data.
I’m very intentional about collaboration. If it takes ten years to find the right form, then it takes ten years. I’m also concerned about what happens when we bring political questions into an art space. Politics and art aren’t separate, but sometimes turning everything into an artistic experience introduces another layer of abstraction. With data and surveillance, I don’t necessarily want you to experience those things as art. I want you to confront what is in front of you. This is surveillance. You are being watched. Even this conversation may end up stored on a platform and subjected to analysis.
I appreciate artistic approaches to those questions, but we risk losing a critical edge when we abstract them so far that we’re no longer talking about the material realities of data. Some of my work on machine learning and AI therefore takes a more research-oriented form: presentations, interviews and conversations. I haven’t yet found a sufficient artistic form for all of it.
What information are they required to disclose? What can someone infer from apparently mundane traces? Which decisions about collection and retention were already made before they arrived?
In some ways I would rather have people work directly with the infrastructures involved than transform the issue into a metaphor too quickly. What information are they required to disclose? What can someone infer from apparently mundane traces? Which decisions about collection and retention were already made before they arrived? Those questions have a material urgency. We can use artistic methods to ask them, but I don’t want aesthetic distance to become a substitute for understanding what a system is actually doing to people.
I can imagine workshops where people examine what data is, what data they’re producing, what is produced about them and what they can retain or refuse. There is a long lineage of resistance to datafication that predates Silicon Valley.
I also think about artists who transform one kind of data into another. Benjamin Patterson, for example, used the movements of ants, photographed at intervals, as the basis for a score. The movement becomes documentation; that documentation is then metabolised into something else. I’ve explored translating material associated with my great-grandmother into sound. Charles Gaines’s systems-based work is another important reference for me. And Tomás Saraceno has worked with spiderweb structures and sound, making relationships between their forms audible.
Those practices interest me because they establish systems and allow unforeseen outputs to emerge. But alongside that, I’m concerned with legibility, visibility and datafication, particularly in relation to death and necropolitics.
It is interesting that the artistic examples involve so many different kinds of translation: movement into photographs, photographs into a score, a web structure into sound. There is a system, and something is carried from one form into another. But I don’t want the fascination of that transformation to make us forget the question of who controls it. The translation of a person’s life into machine-readable material is not the same kind of event as translating an observed movement into a score. They might share technical features while raising profoundly different political questions.
At the moment, I’m researching so-called death bots: companies and initiatives that use someone’s digital traces to make a posthumous avatar that relatives can interact with. There is the person whose data is being used, who is deceased, and the person supplying it to a company to produce this conversational system. You can then talk to your grandmother indefinitely. But when does the datafication end? It clearly doesn’t end with death. Each new conversation with the avatar may become another source of data. We can remain subject to extraction even after we die. I’m interested in those politics, and I don’t yet have an art object that adequately represents them. For now, much of that thinking happens through research and conversation.
Opacity, visibility and the politics of surveillance
Olivier: That brings us to the idea of resisting compulsory visibility. People and communities are continually tracked, measured and classified by digital systems. Does democratic visualisation also require a right to opacity, or even a right to disappear from view?
Kameelah: I think we use the language of democracy as if we all agree on what it means, when we often don’t. When someone talks about the democratic distribution or visualisation of data, I want to ask: in which direction?
The fact that my information is readily available to the state, a corporation or a business is not equivalent to their information being available to me. I can’t necessarily see what they’re doing, where they’re spending money or how they’re paying people. Yet there is an expectation that I should be visible.
I want to trouble the assumption that visibility is a proxy for liberation. I can be visible and still be targeted. In fact, my visibility can increase my targeting.
When we talk about democratic visualisation, I think about redacted files and all the things a state deliberately removes from public view. If people are expected to be on camera everywhere, to log in to everything and to provide biometrics, then why doesn’t the expectation of visibility operate in the other direction? Why can’t we scrutinise those who hold power?
The asymmetry is important. We are asked to treat more disclosure as inevitable or even beneficial, while the institutions demanding that disclosure can invoke secrecy, security or commercial confidentiality. The promise that being seen will produce recognition does not tell us who is looking, what they can do with what they see or whether we can ever stop that process. Sometimes the people already most closely watched are the least protected by visibility.
A student once said something to me that I still think about: the right to opacity doesn’t go both ways. I have a right to opacity as a human being, as a racialised or colonised person. The state should not claim that same right in the same way, given the history of abuses of power.
So when we say democratic visualisation, what exactly are we visualising, for whom and to what end? Too often the burden of visibility, legibility and disclosure falls on ordinary people, not on those accumulating wealth or making decisions.
Visualisations as objects of democratic negotiation
Olivier: One hypothesis we’re exploring is that a visualisation could become an object of negotiation rather than a finished representation. Imagine a citizens’ assembly where participants can move elements, add missing experiences, change categories, annotate a graph or decide that something should be obscured. Could contesting a visualisation itself become a form of deliberation?
Kameelah: I like that question of modularity. One understanding of data is that we gather more of it, then augment, triangulate or corroborate what we thought we knew. There’s a process of revision.
In my installations, modularity already happens as work moves between sites. Objects are arranged differently. Some things are removed and others stay. I have to ask what a piece of information communicates at this height, in this location, at this moment, in this museum. When it moves somewhere else, is it still communicating what I want it to communicate?
I’d love to see an exhibition or curatorial programme in which the public can actually pick things up and rearrange them. That’s often what’s missing in museums. It’s why I still go to science museums: you can touch things, manipulate them, try something and see what happens.
The arrangement of a work is never a neutral frame around the information it contains. At one site, a piece may sit at eye level; at another, it may be across the room or beside an entirely different work. Those decisions change the emphasis. Modularity lets me think about those changes deliberately, instead of pretending that there is a perfect configuration I discovered once and can simply reproduce forever.
Imagine walking into a room and encountering a bar graph. Perhaps you are asked to annotate it, say what’s missing, or question a citation. Perhaps you point out that a category doesn’t make sense or that an experience isn’t included. I like the idea of emendation and revision.
It would also remind us that data is not infallible. Data changes. Measuring and capturing it are active processes, and those processes affect the results. We need to move away from the idea that data is a pristine, objective piece of information and towards an understanding that it is constructed.
I would be interested in a setting where the point isn’t simply for visitors to vote on whether they like an image, or to add a comment beneath a finished graphic. It would be to enter the process by which the information has been made visible. Someone could ask why the categories were chosen, why one experience disappeared into a larger grouping, or why the measure assumes that two situations are equivalent. That turns the work from a statement that asks for acceptance into a proposition that can be revised. It might also reveal that participants disagree not only about conclusions but about what should be counted in the first place.
There’s a pedagogical possibility here. When a system scans my face, it doesn’t simply transfer some natural fact about my appearance into a database. A feature is translated, labelled and made to mean something within that system. The same goes for the numbers we read in the news. If I see an unemployment rate, I should be able to ask: Where did that number come from? When and how was it measured? Who measured it, according to which categories, and for what purpose?
Once we understand data as constructed rather than natural, we can interrogate its sources and the intentions behind its circulation. That can change how we approach democratic discussion.
Imagining a porous democratic data space
Olivier: Let me end with a speculative question. Suppose you were asked to design a space for collective deliberation about a difficult issue, such as homelessness, racism, gender-based violence or restorative justice. People would need to engage with statistics, testimonies, conflicting evidence and forms of knowledge that conventional data systems often exclude. What would a democratic data space look and feel like?
Kameelah: The first word that comes to mind is porosity. I worry about closed systems that seal themselves off from other things and refuse to interact. They protect themselves by preventing anything new from entering.
At the most basic level, I imagine an open-air space. That might seem like a strange place to start, but there’s something important about letting in what needs to come in and allowing other things to be released. The location matters, too. Where in the world are we? Are we outside? What makes people comfortable enough to participate?
I would want people to be able to bring things into the space. Whatever material we started with could never be exhaustive. Someone might bring a recording of their grandmother. Someone else might bring a note from a notebook. We could begin with a generous sense that all kinds of material can enter, and then work together to decide what can be held in relation.
I don’t imagine that everyone arrives with the same kind of evidence or that the material already provided by an institution defines the boundaries of the discussion. A recording from a family member might matter alongside a statistical report, even though they cannot be processed in the same way. The task would be to work out their relationships without demanding that every contribution be converted into one common format before it can enter the room.
I like the ethos of composting alongside the idea of an open-air, porous space.
And something that can’t be related to the other materials at this moment doesn’t have to become waste. Perhaps we compost it, hoping it will return later. I like the ethos of composting alongside the idea of an open-air, porous space.
The physical design would depend on what we’re trying to do. Deciding where to build something is different from discussing restorative justice. In the latter case, we might need court-system data, local histories, audio recordings and accounts from people whose experiences extend ten years beyond a particular intervention.
The kinds of materials we need will change with the question. If we are considering a location for a building, there are particular spatial and practical matters to understand. If we are trying to learn about restorative justice, we may need to hear from someone who moved through a process years earlier and can tell us what its consequences look like over time. Neither a single dataset nor a single afternoon of testimony can settle all of that. The design has to make room for evidence that arrives late and for understandings that change as people continue living with the consequences.
So this isn’t only about the appearance of the room. It’s about duration and devotion: how much time are we willing to commit to studying something collectively? Maybe this isn’t a weekend activity. Maybe it’s a ten-year process of decision-making, with smaller decisions along the way. We might realise that six months of study isn’t enough, and that we need six years.
And I’d want lounge seating. Again, that may sound like a small detail, but people should be able to think, reflect and make decisions while sitting, reclining or occupying whatever position feels comfortable. The body shouldn’t have to disappear for collective thinking to happen.
__
This interview forms part of a series that contributes to an article by Szilvia Nagy and Olivier Schulbaum, which analyses visualisation and spatialisation as practices of co-design, participation and democratic decision-making. The article is currently being prepared for the special issue of CoDesign entitled ‘Designing Democratic Innovation: Co-design and the Future of Participation in Governance’.