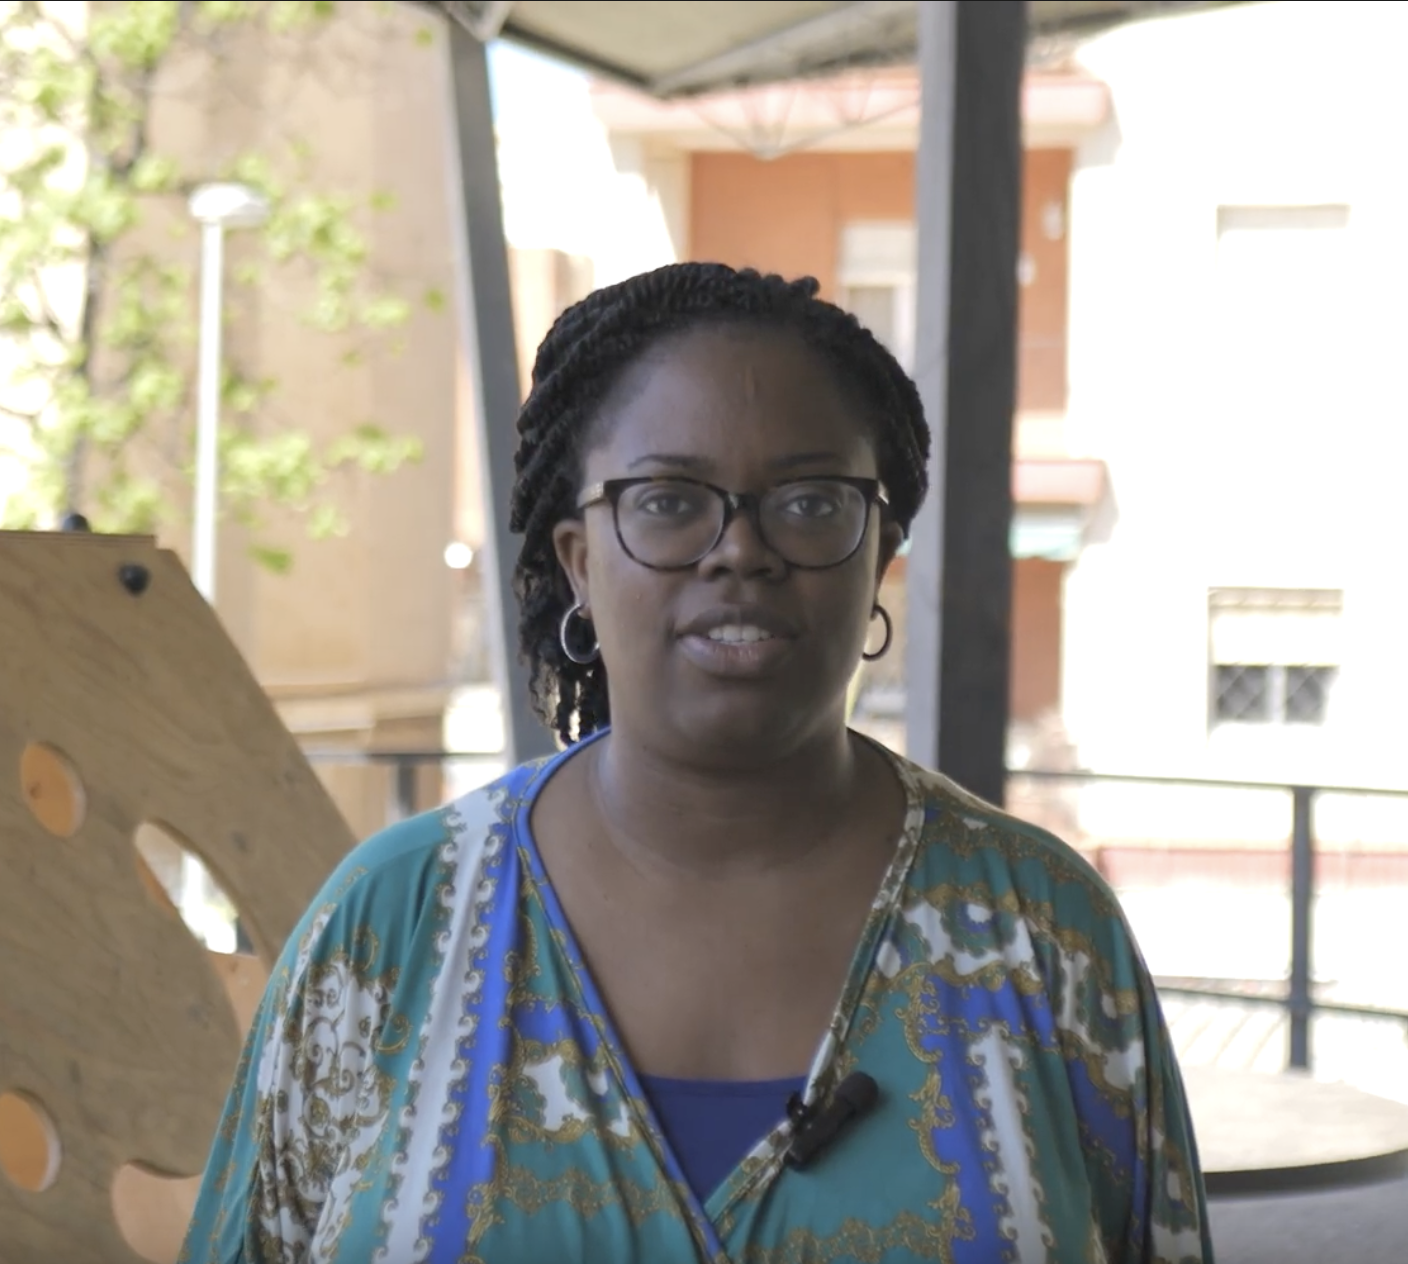
Jason Forrest is a designer, artist, and researcher specializing in data visualization, with a career that spans electronic music, the visual arts, technology, and communication. He was director of the Data Visualization Lab at McKinsey & Company, founded Nightingale, the journal of the Data Visualization Society, and currently runs the Jason Forrest Agency and, together with artist Jen Ray, develops Data Vandals, a project that brings data to the streets through art installations and participatory experiences.
In this conversation, we explore how visualization can become a tool for sparking public dialogue, challenging traditional ways of representing reality, and expanding communities’ democratic capacities. From the graphic pioneers of W. E. B. Du Bois and the Isotype system to urban interventions in New York, London, and Los Angeles, Forrest invites us to rethink data literacy, the relationship between knowledge and power, and the role of emotion and public space in civic engagement. His approach shifts the focus from graphics to people: data should not serve merely to explain the world or convince an audience, but to foster encounters, make shared experiences visible, and open conversations capable of transforming the way we live together.
On Visualization, Public Space, and Data as Catalysts for Democratic Conversation
Olivier: Visualization and its relationship to public discourse and democracy is a particular obsession of mine. How did you get into the field of data visualization, and what other languages have you incorporated into that practice?
Jason: I think the easiest thing is to tell you my story. I studied fine arts and photography. I moved to New York in 1999 because I wanted to become an international art star, but instead I ended up becoming an electronic musician and DJ. Then I moved to Berlin in 2003 and performed all over the world for about ten years.
In 2008, I got into technology because a musician friend told me, “Apple is launching this App Store next month, so we should jump on the bandwagon.” I knew absolutely nothing about technology, but we made a couple of music apps, and that introduced me to agile methodologies and a different way of thinking about how software is built.
Later, I co-founded an online video startup. It almost worked—which is another way of saying it didn’t work—but I learned a tremendous amount about business. After that, I worked as a UX designer building backend systems for insurance companies. It sounded incredibly unsexy, but I was fascinated by the complexity: how the systems were organized, how information was recorded, and how you could retrieve it later. That’s where my interest in data and data infrastructure really began.
I finally landed a job at McKinsey. I worked there as a UX designer for about two years, but I started to get bored. The process seemed too dogmatic to me, and on top of that, everything was always user-centered. I was designing things to improve the efficiency of tasks for other people, and I missed having some room for personal expression. Then the opportunity arose to join a data science team. I proposed a very simple exchange: “I can teach you design, and you can teach me about data.” That’s when my obsession with data visualization really began.
At the same time, I was becoming very interested in typography, especially its systemic dimension: how a tiny change in one part of a typeface can have effects throughout the entire system. It was then, while leafing through a book, that I came across W. E. B. Du Bois’s graphics. I was completely fascinated.
I started doing some research and discovered that practically no one was talking about those visualizations. My first article was supposed to be a standalone piece, but every sentence raised five more questions. I ended up spending about eighteen months immersed in Du Bois’s world. I think I was fascinated by him because he seemed to be following a path that, in some ways, resembled my own. He wanted to leave a mark on society and was convinced that it was possible to do something radically different simply by presenting the data.
When COVID hit, McKinsey asked me to help with visualization work related to the pandemic. They gave me a team of about twenty people, and for roughly a year and a half, we produced visualizations on health and the economy. It was an extraordinary environment for experimentation—and also the time when I launched Nightingale.
At the same time, I was becoming obsessed with Isotype. In one of the books, I found a tiny reference to the fact that Otto and Marie Neurath had put on puppet shows using Isotype. The idea stuck in my head. My wife and I had already done some poster projects in New York during the pandemic, trying to foster a sense of civic pride. Data Vandals eventually emerged from that combination. The initial question was very simple: What happens when you take data out of the digital world and place it in the physical world? That question ended up completely changing my practice.

Data as a Pretext for Conversation
Olivier: You’ve gone from Du Bois to the streets, incorporating music, art, technology, and design. What’s the common thread?
Jason: It might sound a little corny, but I think it all comes back to the community. Du Bois was an extremely unique figure, but around 250 people participated in the Exhibition of American Negroes. It was almost like a small nation. Something similar happens with Isotype: it wasn’t just a creative way to communicate information on a large scale, but a practice deeply concerned with dialogue with the public.
When we started Data Vandals, we didn’t realize the project would end up taking us there. But over time, I realized I was more interested in the conversations than in the data itself. We use data to spark a conversation. Ultimately, the data isn’t what matters. What matters are the people gathered around it and the interactions that arise between them.
What Du Bois’s Charts Brought to Light
Olivier: What made Du Bois’s visualizations so powerful? Was it aesthetic innovation, narrative clarity?
Jason: What surprised me most was the depth of the project. It was structured like a narrative. There are stories about development, land ownership, education, comparisons with other groups, and an international perspective on the African American population as a “small nation.” And all of that had been all but forgotten.
I grew up in the southern United States, and there were entire parts of African American history that I had never heard of. As I analyzed the charts, I started by simply asking myself: What does this data actually represent? I followed Du Bois’s references, and entire chapters of American history that I’d never had access to before came to light. That changed my understanding of American history and, to some extent, of myself as well.
Olivier: You’ve also discussed some current interpretations that directly link Du Bois’s graphics to modernism.
Jason: Yes. I have pretty strong opinions on that. I find the idea that the language of modernism was directly influenced by Du Bois very problematic.
I come from the art world and have spent a lot of time with art history. What seems more plausible to me is that Du Bois, as a young researcher, was observing European science and using certain visual languages to develop his work and establish himself intellectually. The way he arrived at those hand-drawn graphs is part of his genius, but that doesn’t necessarily mean there’s the modernist lineage that we sometimes want to construct in hindsight.
Do we really have a “data literacy” problem?
Olivier: Many schools teach statistics or media literacy, but very few teach visualization as a kind of civic language. Do we need greater data literacy?
Jason: This is where it probably gets controversial, because after giving it a lot of thought, I’ve come to believe that data literacy, as it’s usually framed, starts with the wrong question.
It often seems to consist of teaching people to better understand our charts. I believe the responsibility should be reversed: it’s up to us designers to create things that people can understand. We shouldn’t be teaching people to understand our work.
With Data Vandals, I’ve spent years showing all kinds of people some pretty strange graphs, and almost no one ever asks me, “How do you read this?” They might ask what the data means, but they usually understand perfectly well that a number can be represented by a shape, a color, or a position. Then you start to wonder what “data literacy” really means. Are we teaching people to better understand the world, or are we simply teaching them how to use Tableau?
From Complaint Data to Data About What We Love
Olivier: Perhaps the issue isn’t learning to consume visualizations, but participating in their creation. Can the co-creation of a visualization be part of a democratic process, especially when the people most affected by what we’re representing are involved?
Jason: One hundred and ten percent. That’s exactly what we’re working on right now. One of our recent projects is LA Loves, with the City of Los Angeles. Working with different cities, we realized the importance of 311—a number used in the United States for non-emergency issues that has, over time, become practically a centralized system for managing municipal complaints.
The problem is that it primarily generates negative data. “Fix this pothole,” “There’s a noise problem,” “The water isn’t working.” And when you look at municipal open data portals, you discover that a large portion of the data a city has about itself comes precisely from problems.
So we asked the city of Los Angeles a very simple question: What do people like? They didn’t know. That’s how LA Loves was born. We want to build a positive complement to 311: a dataset centered on the city’s affinities.
There have been cases where certain murals or parks were deeply cherished by a community, yet they were still removed or altered. People reacted when they found out, but it was already too late. Why not collect that kind of information as well before making decisions?
When a Sticker Sparks a Conversation
Olivier: An interesting aspect of your work is that participation doesn’t necessarily depend on writing a script. Can visualization make knowledge visible that is difficult to express through language alone?
Jason: Yes. One of the most important lessons came from a project we did in London. We used a kind of grid, and people placed stickers to respond. They understood perfectly that by placing a sticker, their opinion was becoming quantifiable data.
But something happened that we hadn’t anticipated. The posters were mounted on very lightweight aluminum frames, and since the wind could blow them over, someone always had to be there to hold them in place. When a person approached, placed a sticker, and saw someone standing next to the chart, they almost always began to explain why they had chosen that answer.
Perhaps there’s a psychological need to justify yourself to the person in front of you, or simply to be understood. But that explanation became the starting point for a conversation. Then the conversation would branch off depending on who was there, what other people had said, or how the graph was changing. At a certain point, the people themselves began to conduct a collective analysis of the data.
That’s when I realized we weren’t really talking about data anymore. We were talking about experiences derived from the data. And that’s why I always come back to the same idea: the data doesn’t matter that much. What matters are the people around it.
For someone who works professionally with data, it can be difficult to accept that the work is transactional—that it’s really just a means to an end. But for me, it was a turning point.
Positive Data and Public Policy
Olivier: How can all of that inform policy-making?
Jason: One of the interesting things about Los Angeles is that the government is very concerned about the low level of civic pride. We thought that asking people what they love about the city could yield useful information, but might also help foster a sense of pride during the process itself.
What was truly revealing was showing the results to deputy mayors and officials from departments like sanitation, libraries, and parks. Everyone wanted to see that data because they told us they’d never had that kind of conversation before.
That also led me to research happiness and well-being indices. Bhutan, for example, has gone so far as to incorporate happiness-related metrics into the development of policy proposals. In New Zealand, indigenous participation led to the incorporation of dimensions related to spiritual well-being.
That raises interesting questions about what we consider valid data for governance. We can ask where you feel comfortable in your community, but also where you feel centered, or where you feel a connection to your surroundings. Building those kinds of datasets can be quite radical.

cc-by-sa Platoniq
The Work Behind the Data
Olivier: Du Bois’s research also features his students and assistants. Can we think of them as an early generation of data workers?
Jason: Yes, although I think we need to be very careful with that narrative. There’s a recent trend suggesting that perhaps it was the students who actually did the work or were even co-authors of the visual narrative. The problem is that we have very little information about them, and when there are gaps in the documentation, there’s a risk of filling them in with speculation.
What we do know is that Du Bois was training students in the social sciences: how to conduct interviews, gather information, and transform documents into statistics. We also know that they participated in the actual creation of the charts. So, were they data workers? Absolutely.
That said, Du Bois was also very hierarchical, and we don’t have enough evidence to assert that the process of constructing the narrative was as horizontal as we might like to imagine today. That doesn’t mean the project wasn’t deeply collective. Around 250 people participated in one way or another in the exhibition, from gathering information to photography and liaising with community leaders.
When the Community Begins to Analyze Its Own Data
Olivier: What happens when you apply that logic to contemporary public data collection?
Jason: Something that fascinates me is that the very form of the data can begin to transform. We can design a very orderly grid, but when people start adding stickers, strings, or new categories, the information begins to escape the boundaries we had anticipated.
And then comes an even more interesting moment: once there are enough responses, the next person doesn’t just contribute their own data—they begin to analyze the data from the people who came before them. You’re providing a template, but the community fills it in, creates a pattern, and then begins to interpret that pattern collectively. That’s when the process changes completely.
Inhabiting the Data
Olivier: What happens when the visualization is no longer simply in front of us but becomes a space we can inhabit?
Jason: It’s something we’re experimenting with a lot. For example, we held a workshop-exhibition in Budapest centered around a beloved but under-resourced park. There weren’t enough restrooms, so one of the visualizations was a Venn diagram where people indicated whether they had urinated at home, outside, or in the park itself. It might seem silly, but it allowed us to talk about infrastructure in a completely different way.
We also incorporated little stories about the place: what used to be there, how the space had changed. I’m very interested in what I’d call the “psychic space” of a place—the combination of culture, memory, history, safety, and enjoyment that determines how we experience it.
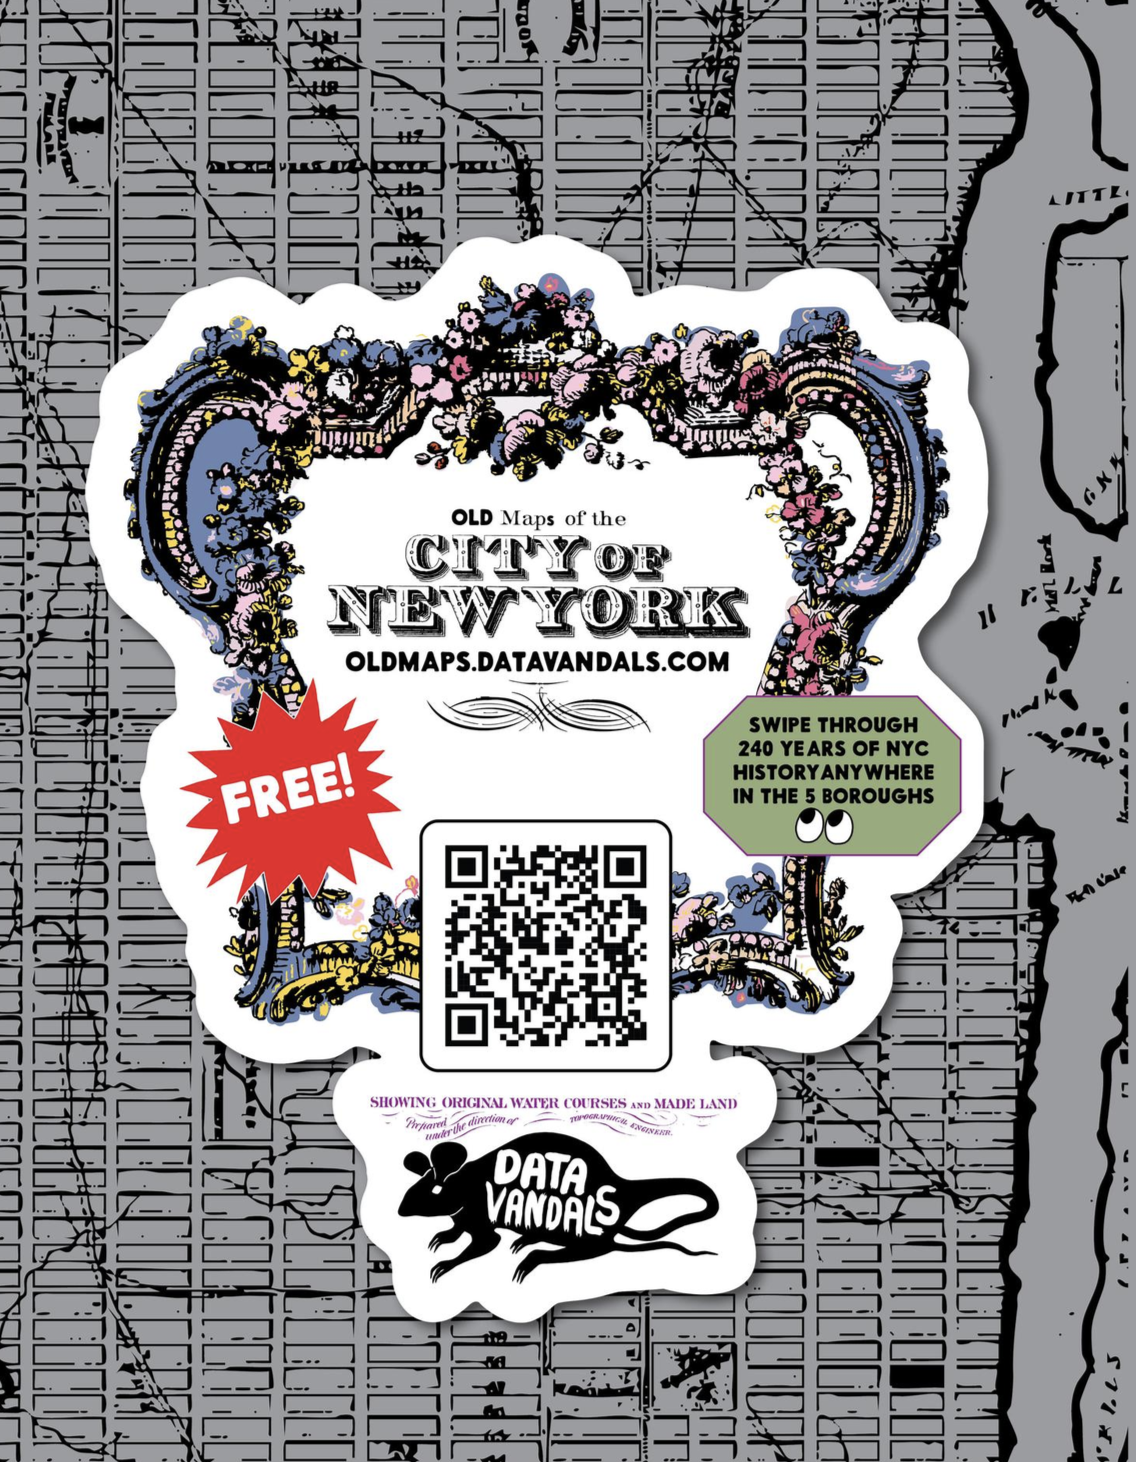
We’ve done something similar in the New York City subway. One of the pieces depicts about four hundred years of Midtown’s history. A man told me he’d been reading it for weeks because he waited for the subway in exactly the same spot every day. He asked me why we’d included so much text, and I told him, “Precisely for people like you. We knew you’d be here every day and that you could read a different excerpt each time.” That kind of experience changes your relationship with the place.
What if we changed citizens’ assemblies too?
Olivier: Citizens’ assemblies tend to follow a fairly set routine: people gathered around tables, experts presenting finished information and charts. What would happen if the visualization and the space itself were part of the deliberation?
Jason: I think there’s enormous potential there. At LA Loves, for example, we use the posters directly as inputs for a dataset. One question might be: “If you could give the city a gift, what would you invest in?”
Another question has to do with volunteering. The city was surprised to discover how many people were willing to volunteer their time because it simply didn’t have that information.
We also saw that street vendors generate quite a few complaints through 311 regarding noise or sanitation, but when you ask residents, they emerge as one of the most beloved aspects of Los Angeles. This immediately reveals a disconnect between the city as depicted in administrative data and the city as experienced by people.
Much of urban decision-making still takes place behind closed doors. Our goal is to bring some of those inputs into the public sphere so they can be discussed there as well.
Isotype and Design That Reaches Out to People
Olivier: Let’s go back for a moment to Otto and Marie Neurath and Isotype. I’m particularly interested in that story about the puppet shows, because it seems to imply a desire to create collective experiences, not just to convey knowledge.
Jason: The funny thing is that, as far as I know, there are no photographs of those shows. I love that we have to imagine them. But we do know that Neurath was deeply interested in public literacy and that she developed the Isotype system in a context where illiteracy was still relatively common in Austria.
What’s most interesting is that they worked in a surprisingly iterative way. Marie Neurath would take groups of schoolchildren to see the visualizations, observe what they understood, and then bring that feedback back to the graphic design team to modify the designs. That’s very much like what we’d call user-centered design today.
And it reinforces my issue with the idea of data literacy. If people don’t understand the graph, the problem shouldn’t be that people need training to catch up with the designer. The designer’s job is to meet them halfway. When you go out into the street and someone doesn’t understand what you’ve done, that’s your problem. Not theirs.
Emotion, Visualization, and Democratic Capacity
Olivier: So maybe we should talk more about visual literacy, understood as the ability to interpret or even reframe a representation.
Jason: Yes, though I’d add one thing: people are already constantly experiencing emotions. We don’t have to “introduce” emotion into the data. The emotion is already there. What you can do is use it to spark curiosity or empathy, without necessarily resorting to manipulation or slogans.
At Data Vandals, we try to help people see themselves reflected in the data. For example, we have a piece about summers in New York that starts by asking, “What are you going to do this summer?” It’s a completely everyday question. But as you read on, it eventually leads you to a question like, “Do you think politics is ruining patriotism?” You start by talking about whether you’re going sailing or visiting your family, and you end up getting into a much broader political conversation.
Visualization as Music
Olivier: You’ve also been a musician. What can data visualization learn from music or dance?
Jason: I think they reveal structures. When I moved to New York, I became really interested in contemporary dance because you could sit in a theater and see how certain ideas took shape through bodies moving in space. Music works in a similar way. You can hear how different structures organize themselves over time and how emotional intensity builds.
There’s a visualization of Coltrane that I love because it shows the notes moving almost as if they were building a house. Is it exactly a data visualization? No. But it lets you understand that you’re not just listening to someone play the saxophone. You’re perceiving someone organizing ideas.
You can also do something similar by putting quantities into context. You can say that New York has 7,400 miles of sewer pipes, but if you convert that into a recognizable distance, suddenly a different relationship with that number emerges. You don’t always have to physically experience something to understand it, but you can build frameworks that allow you to sense its scale.
When the Chart Becomes an Authority
Olivier: Politicians also use charts constantly on television. They almost function as symbols of authority.
Jason: Exactly. That’s the trap. The chart is presented as the truth. It’s used to say, “Here’s the evidence that backs up what I’m saying.” But you can have the most technically accurate chart in the world, with the correct axes and flawless language, and still be constructing something completely fraudulent. Data can become a weapon.
And I think this happens in fields like sustainability, too. We’ve shown, time and time again, enormously complex charts about emissions, chlorofluorocarbons, or megatons of carbon, and for many people, none of that means much. That’s why I find examples like the warming stripes interesting. Blue means cold, red means heat. You don’t need a huge explanatory apparatus.
Olivier: I recently saw something similar in Libération. An entire page on extreme temperatures shifted from red to yellow. The text was even harder to read, but you could almost physically feel the heat coming off the page.
Jason: And that raises a fundamental question about data storytelling. We’ve often assumed that if we tell a story well with data, we’ll win the argument. But that assumes the person will agree with you.
With Data Vandals, I’m trying to do something a little different. I don’t need you to come away with a different opinion. I don’t even know if it will change your level of awareness. What I want is to use data as a bridge to get you talking.
Social Training for Data Professionals
Olivier: To wrap up, is there anything you think is missing from the way we currently work with data?
Jason: I think data professionals need a lot more social training. Charts have become a substitute for authority, but when you actually go out and talk to people, you discover that data needs context. That might mean having data specialists work with designers, communication specialists, or experts in the specific field.
I once worked with the New Jersey Department of Health, and the data team barely spoke to the medical team, even though they were working on the same floor. As a result, there was a lack of context when the data was presented.
So yes, I think we need more social training around data. Because, in the end, we come back to the beginning: data isn’t what matters. What matters is what happens between people when we share it.
__
This interview forms part of a series that contributes to an article by Szilvia Nagy and Olivier Schulbaum, which analyses visualisation and spatialisation as practices of co-design, participation and democratic decision-making. The article is currently being prepared for the special issue of CoDesign entitled ‘Designing Democratic Innovation: Co-design and the Future of Participation in Governance’.